scTPA manual
Introduction
scTPA is a web tool for single-cell transcriptome analysis and annotation based on biological pathway activation in human and mouse. We collected a large number of biological pathways with different functional and taxonomic classifications, which facilitates the identification of key pathway signatures for cell type annotation and interpretation. The executable codes of four different methods of pathway activation evaluation were optimized to yield a 4- to 56-fold decrease in run time. The analysis and visualization of single-cell pathway activation profiles, such as cell clustering and annotation, identification of marker pathways and their associated genes are provided, which allows for an improved understanding of cell type and status from a pathway-oriented perspective. A schematic overview of the scTPA web tool is presented below.

Quick Start
We have provided two examples (example 1, known cell labels, small cell numbers; example 2, unknown cell labels, large cell numbers) for users to familiarize themselves with our web tool quickly. Information, including the number of page visits and locations are automatically collected and analysed for the improvement of our service.
Example 1
Example 1 is a dataset containing single-cell transcriptome data of peripheral blood mononuclear cells with known cell types and small cell numbers.
In this example, we will perform the analysis using a published dataset of peripheral blood mononuclear cells (PBMCs) freely available from 10X Genomics [Grace X. Y. Zheng et al. Nat Commun. 2017, PMID: 28091601]. We randomly selected the gene expression count of 500 cells across five cell types for the example1 dataset. The analysis will take approximately 1 minute.
Import example data:
- Make sure that the "Homo species" is selected.
- Click the "Example 1" button on the homepage.
- Click "run".
Output
The output page shows analysis results of pathway activation for distinct cell populations with pre-defined labels. Interactive tables, scatter plots and heatmap plots were generated to facilitate the illustration of the results. The main files can be downloaded for further inspection and deeper analysis by clicking the Download button.
Example 2
Example 2 is a dataset containing single-cell transcriptomics data of human melanoma tumor with unknown cell type labels.
In this example, we will perform the analysis using a published dataset consisting of 1,167 human single malignant cells of melanoma tumor from the Smart-seq2 protocol [Tirosh I et al. Science. 2016, PMID: 27124452]. This example will take approximately 3 minutes to run on scTPA.
Import example data:
- Make sure that the "Homo species" is selected.
- Click the "Example 2" button on the homepage.
- Click "run".
Output
The output results are the same as those from example 1, except for an additional cell type annotation file from cell clustering analysis.
Recommendation
We recommend the user to run our examples to understand the usage of our tool quickly. If the user wants to explore the results of our examples, the user can obtain the results of our examples directly in the Job queue page or using the result retrieve function on the Job Retrieve page using the corresponding IDs.
Additionally, it is highly recommended to provide an e-mail address to receive a notification when results become available. The user will then receive a message stating whether the job was completed successfully or with an error. You may also bookmark the results page after submitting your data.
Input & Data processing
Single-cell RNA-seq profile
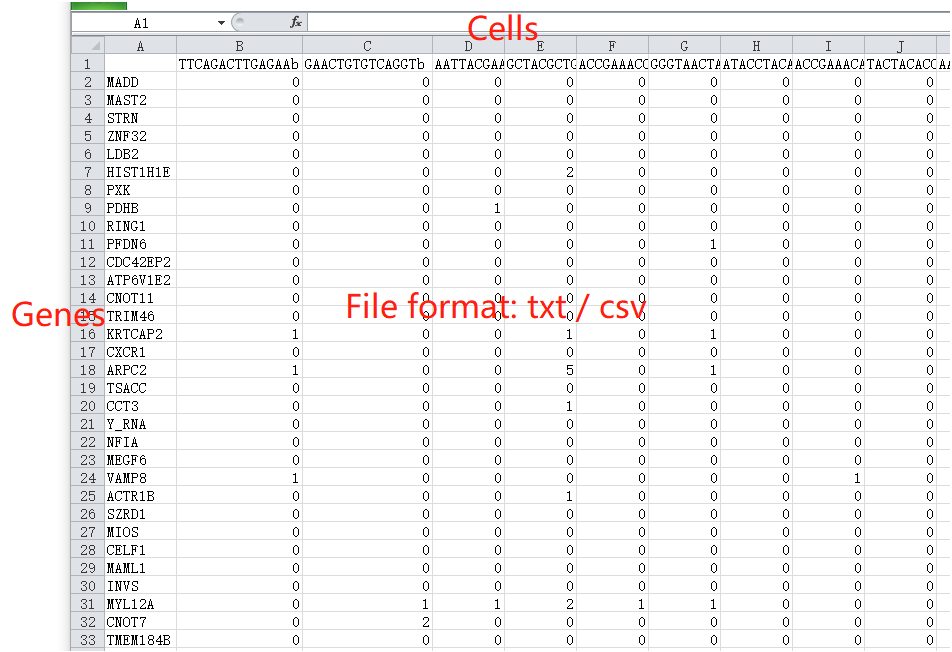
The input single-cell RNA-seq profile is a tab- or comma-separated plain-text file endingin ‘.txt’ or ‘.csv’. The processed gene expression profile can be generated using different platforms, such as 10X genomics and Smart-seq. The values in this profile should be non-negative, and this file can be uploaded depending on data types of UMI count, read count, RPKM, FPKM, CPM or TPM.

The plain-text file must include annotations of gene names (the first column) and cell names (the first row). scTPA can recognize gene symbols and Ensemble IDs automatically. The input file can be compressed in .zip, .tar, .bz2 or .tar.gz format. Click here for an example of a single-cell RNA-seq profile.
Cell-type label (Optional)
The cell-type labeling file is used for the pre-definition of cell populations for single-cell profiles, and this file is optional for users to upload for scTPA analysis.
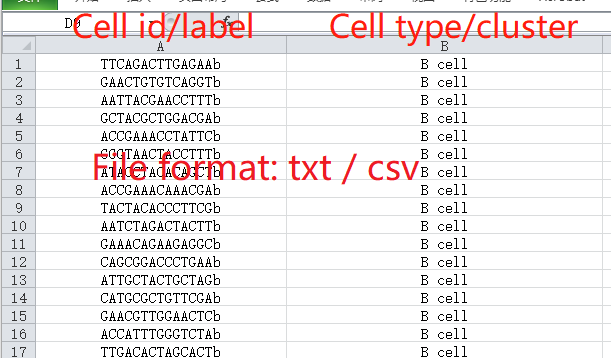
The cell-type labeling file should also be a comma- or tab-separated plain-text file matched with the single-cell RNA-seq profile used above. The first column in the file represents the cell names consistent with those in the single-cell RNA-seq profile, and the second column in the file represents cell populations defined by the users. Click here for an example.
If this file is uploaded to the web server, the main purpose of scTPA is annotating and interpreting the cell populations based on pathway activation signatures by ignoring the cell clustering step. Otherwise, the potential cell populations will first be determined by clustering analysis of pathway activation scores of each cell, and subsequently the analysis and annotation are performed.
Pathway selection
Pathways are biological network models defining how biomolecules cooperate to accomplish cellular tasks in different contexts. The assessment of pathway activation is a promising strategy to obtain answers to diverse questions, such as discovering molecular mechanisms in cells, studying diseases and drug development. To facilitate the evaluation of pathway activation at single-cell resolution, the ‘Canonical pathway’ and ’Extended pathway’ options were provided for the user to select literature-curated pathways of interest. Furthermore, the user may also upload their pathways of interest for specific analysis.
Canonical pathways
A total of 51,210 human and 1,762 mouse canonical pathways were collected from seven widely used pathway databases, such as KEGG and Reactome. Notably, these literature-curated pathways were grouped into six different categories, namely general, metabolic, signaling and regulatory, genome maintenance, drug and small molecules, and cancer pathways. This enables the selection of the relevant pathway database according to the interests of researchers.
Extended pathways
Extended pathways in scTPA represent various sets of unordered and unstructured collections of genes, which could be associated with a specific biological process (e.g. cell cycle), location (e.g. on chromosome 1), disease (e.g. breast cancer), cell identity, cell state or cell fate.
Extended pathways more widely cover biological functions with genetic and chemical perturbation, computational analysis of genomic information, and additional biological annotation compared with traditional canonical pathways. Currently, the extended pathways option contains 19,367 pathways from 9 categories for human data, and 19,385 pathways from 5 categories for mouse data. These were mainly collected from The Molecular Signatures Database (MSigDB).
User defined pathways (Optional)
In addition to pathways included in the Canonical pathways or Extended pathways groups, the user can upload pathways of interest which are not cataloged by scTPA. We support files of user defined pathways in the standard GMT file format. Click here for an example.
Advanced parameter settings
scRNA-seq preprocessing
Parameters for three aspects in scRNA-seq pre-processing, including data normalization, profile filtering and missing value imputation are available.
Data normalization: There are four methods for normalization. No normalization is performed by default.
- --Log transform: Feature counts output for each cell is divided by the total counts for that cell and multiplied by 1e4. This is then natural-log transformed.
- --Centered log ratio: A commonly used Compositional Data Analysis (CoDA) transformation method.
- --Relative counts: Feature counts output for each cell is divided by the total counts for that cell and multiplied by 1e4 (for TPM/CPM/FPKM/RPKM this value is 1e6).
- --Size factor (scran): The normalization strategy for scRNA-seq is implemented based on the deconvolutional size factor using the scran R package.
Profile filtering: The user can apply or remove filters based on:
- --Min_cells: Genes must be in a minimum number of cells.
- --Min_genes: Cells must have at least the minimum number of genes.
The default threshold of --Min_cells is 3 and that of --Min_genes is 200.
Missing value imputation: Imputation of scRNA-seq data may be helpful for the identification of biologically meaningful cell populations and characterization of pathway activation in single cells. scTPA could impute the missing value of the data matrix after normalization and filtering steps, and this function is performed using the R package scImpute.
Please note that this step will take a long time, particularly when the cell type labels are not pre-defined.
Pathway activation score calculation
Four classical and state-of-the-art methods, including ssGSEA (single sample gene set enrichment analysis), GSVA (gene set variation analysis), PLAGE (pathway level analysis of gene expression) and combining Z-scores, were incorporated into the scTPA tool to measure the activation of biological pathways or molecular signatures for individual cells. The four methods were collected and implemented to calculate pathway activation scores from the processed gene expression matrix using the R/Bioconductor package GSVA. To reduce the calculation time, the main loop function was re-implemented using c++ by Rcpp.
Cell clustering and annotation
If users do not upload a cell type label file, we will cluster cell populations based on the pathway activation score matrix using six methods, including Seurat, K-means, K-mediods, SIMLR, DBSCAN and hclust. All cluster functions group cells into distinct populations according to the cluster parameters. In addition, we provided the options of the main parameters for these clustering methods, including the number of clusters, resolution and dimensions of principal component analysis (PCA) in the advanced setting panel. All methods are applied using the R packages SIMLR, cluster, stats and Seurat. Please refer to the description of the corresponding R packages for more details.
Identification of cell-type-specific pathway signatures
This step will identify cell-type-specific activation pathway signatures in all cell populations using five commonly used differential expression methods. All functions are wrapped and modified by the FindAllMarkers script in the R package Seurat. The two parameters “logFC.threshold” and “min.pct” were provided to allow flexible screening of significant activated pathways.
- --logfc.threshold: Limit testing to genes which show, on average, at least X-fold difference (log-scale) between the two groups of cells. Default is 0.25.
- --min.pct: Only test genes that are detected in a minimum fraction of min.pct cells in either of the two populations. Default is 0.1.
Output
The Job Progress section records the whole process of the job.

Once the results are available, you may fetch your results via the bookmarked page within 7 days. The analysis results can be downloaded by clicking the buttons for different types of files.

Pathway activity profile
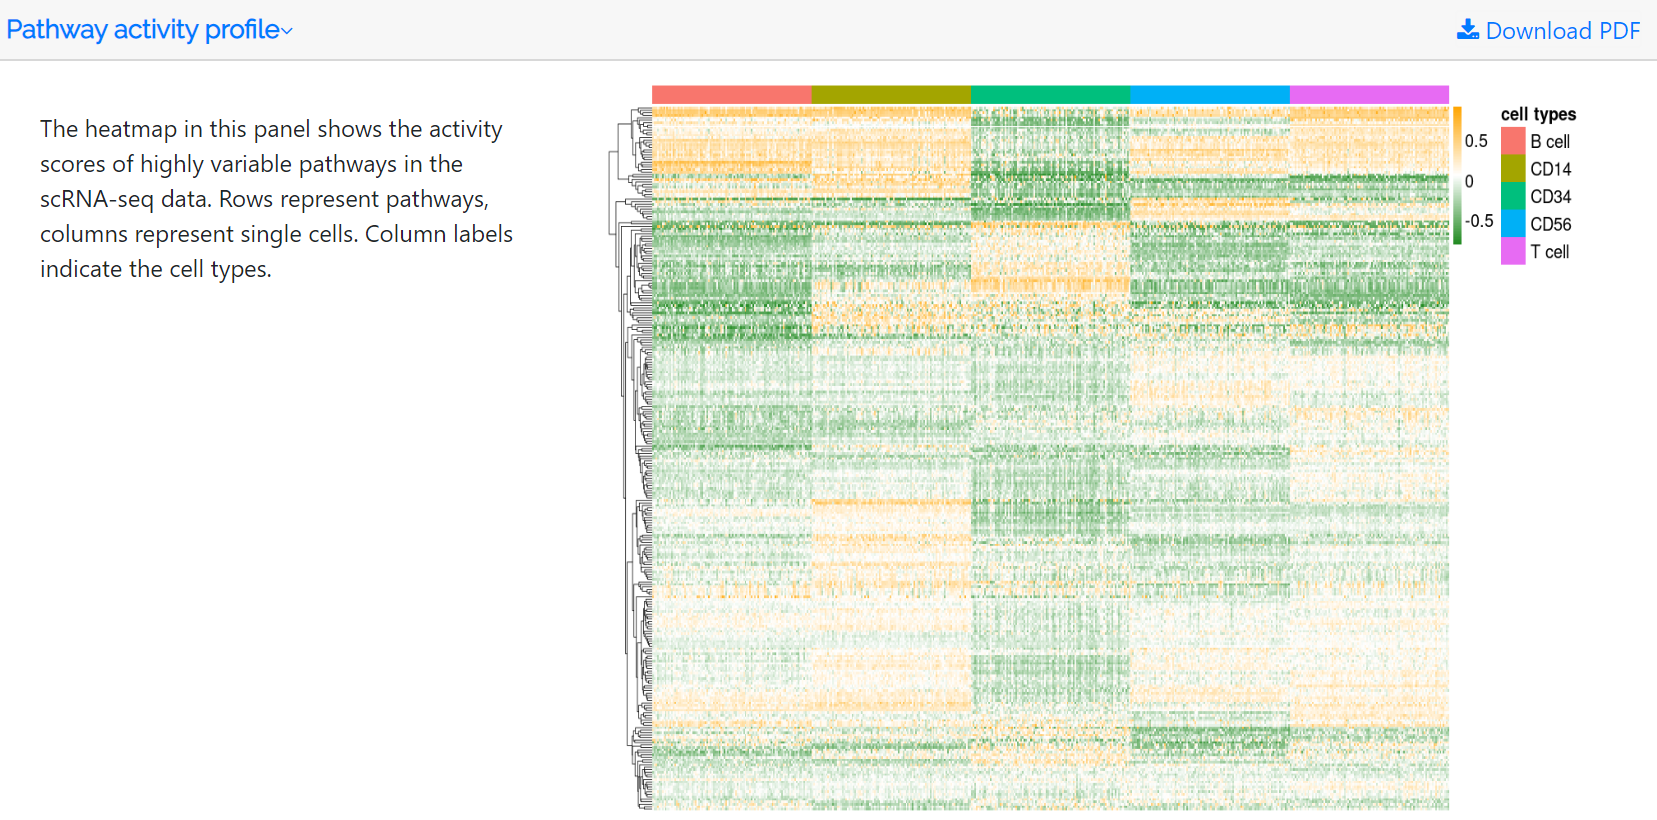
The standardized variance and mean of each pathway in the pathway activity profile are calculated. Highly variable pathways are obtained based on the mean-variance relationship using the FindVariableFeatures function in the Seurat package. The heatmap in this panel shows the activity scores of the top 500 highly variable pathways. Rows represent pathways, whereas columns represent single cells. Column labels indicate the hierarchically clustered cell types. Users can download the pathway activity score file and the corresponding PDF file.
Cluster analysis and non-linear dimensional reduction
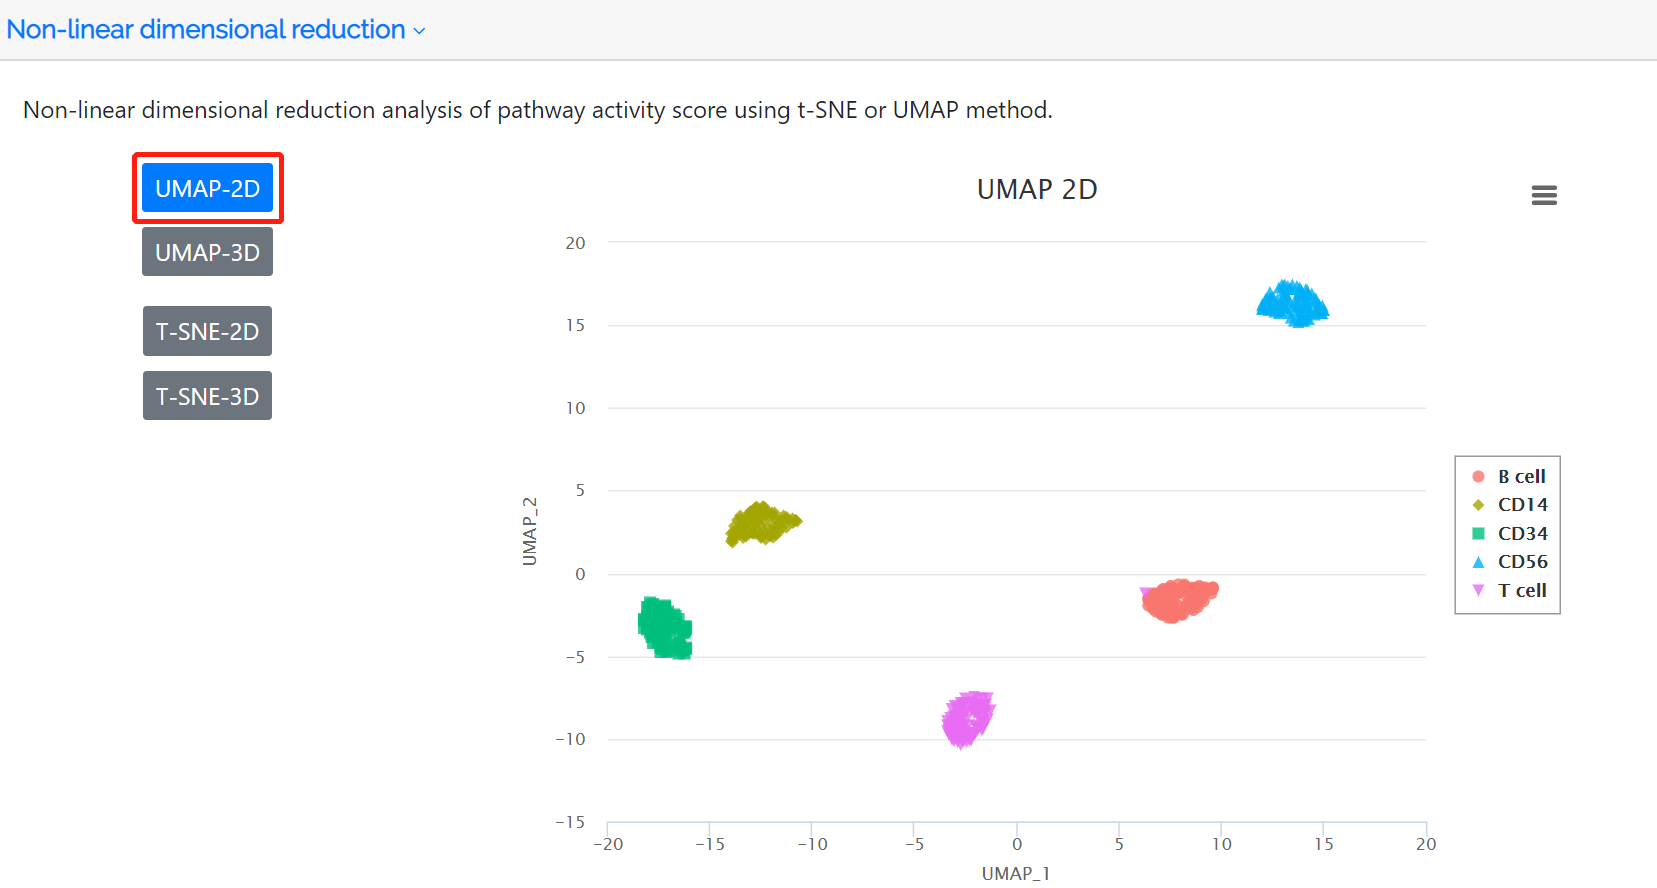
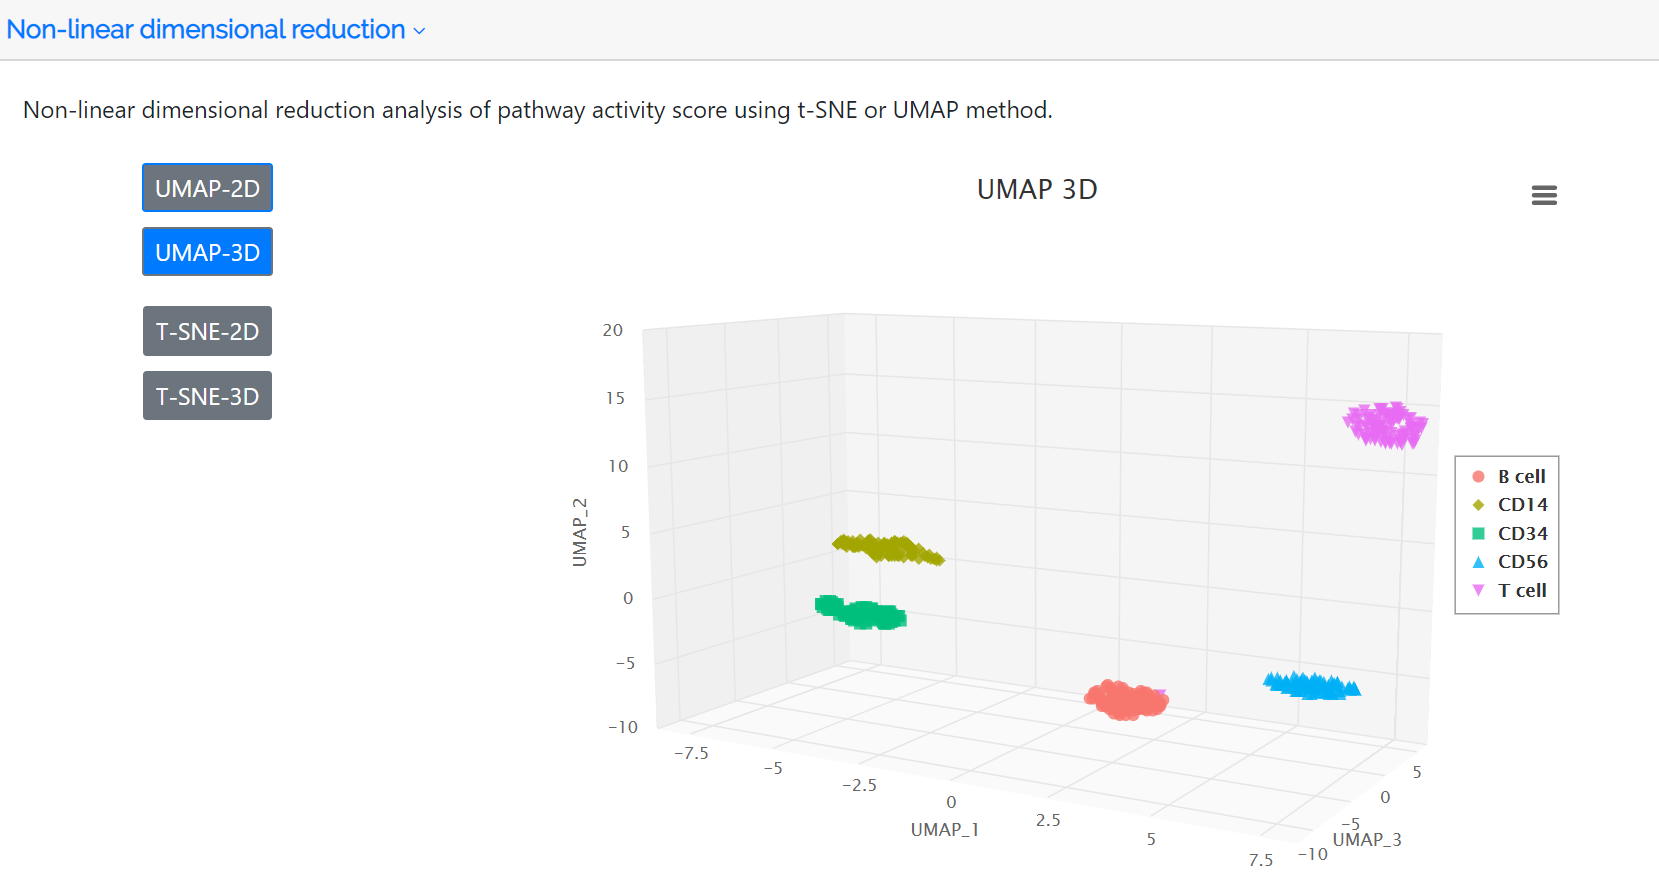
Following identification of highly variable pathways, the clustered cell populations based on PAS in two or three dimensions using the t-SNE or UMAP method are displayed in this panel. The colors represent the cell type label which is annotated either by the user or the clustering analysis of the PAS matrix.
Pathway signatures
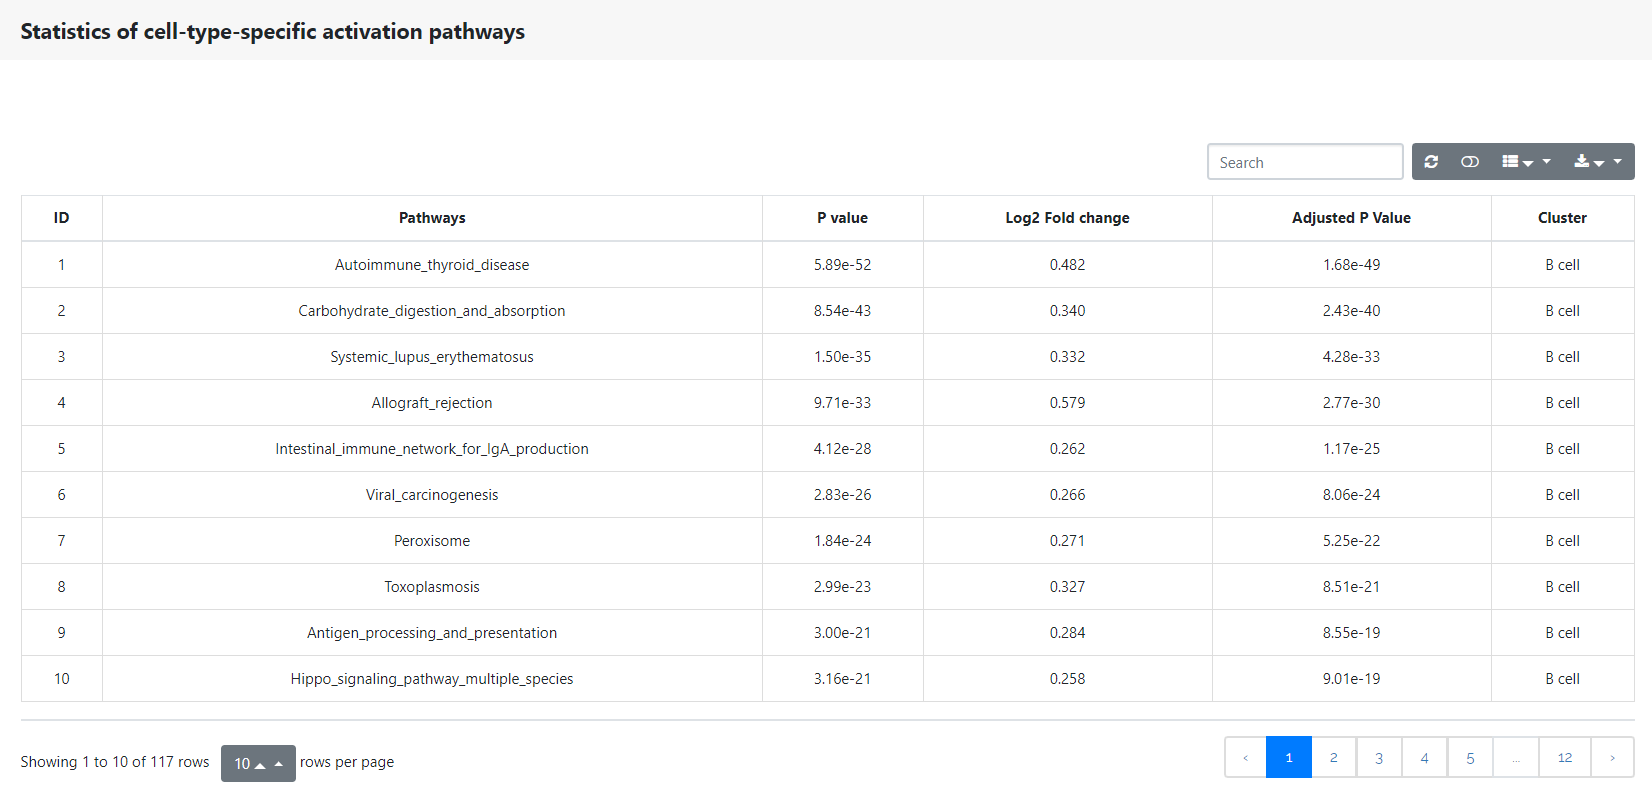
This panel shows the conserved cell type pathway signatures across conditions. The table below shows the statistical analysis of all cell-type-specific activation pathways.
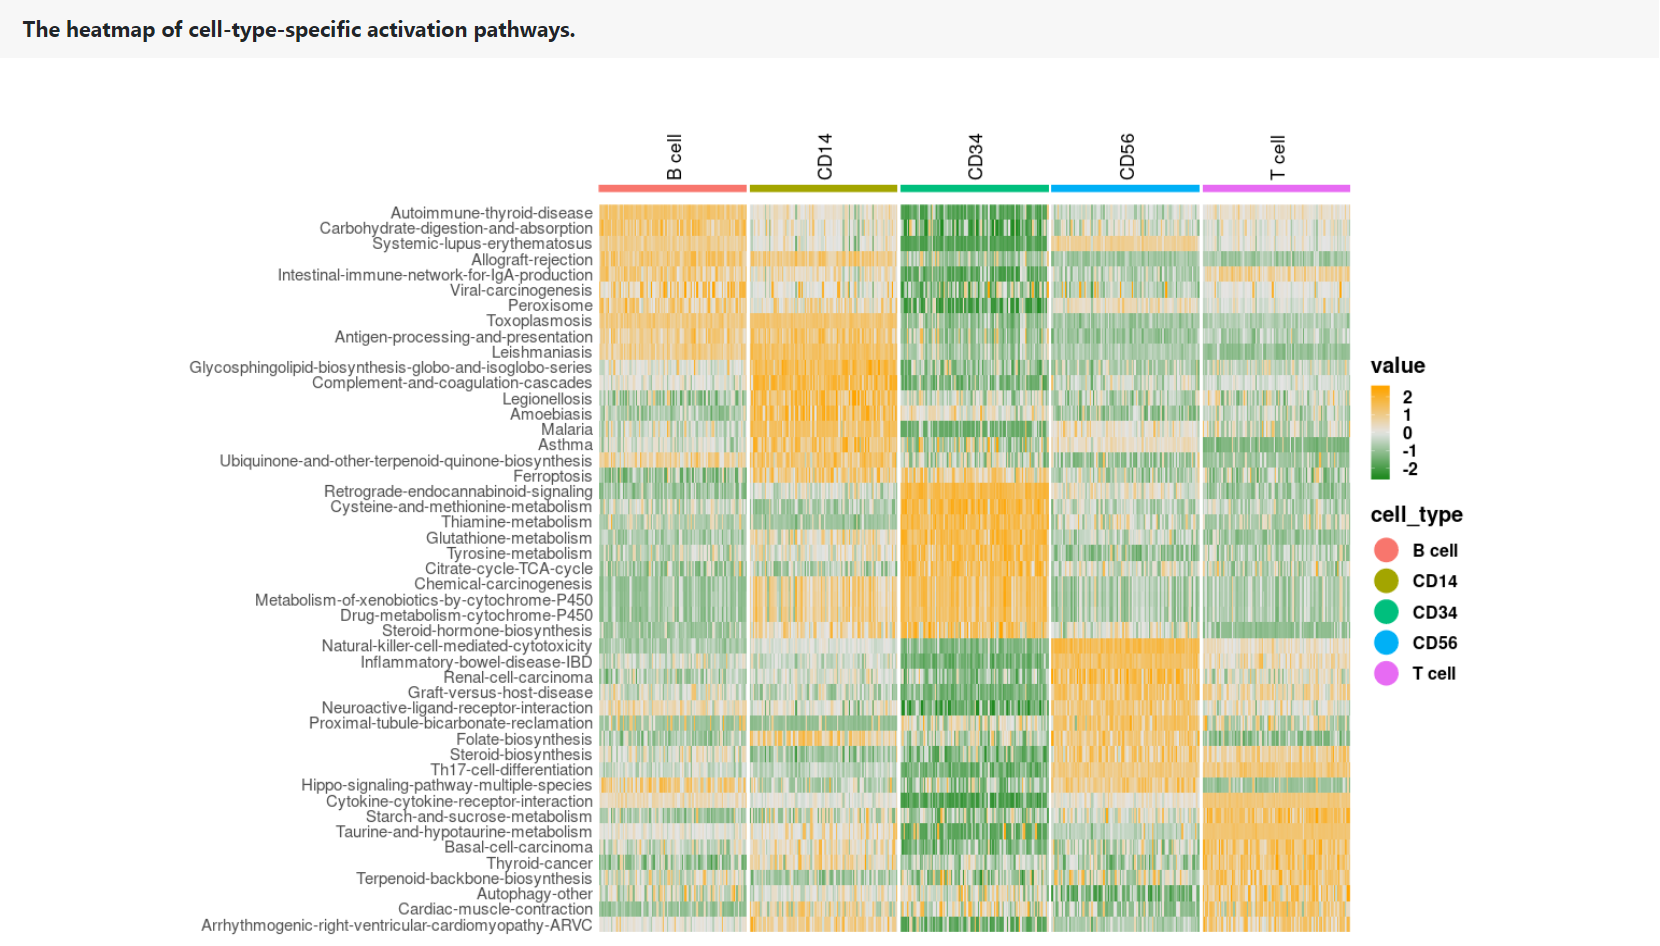
The heatmap shows the PAS profile of the top 10 pathway signatures in each cell type. Rows represent pathway signatures. Columns represent single cells, which are color-coded according to their cell types.
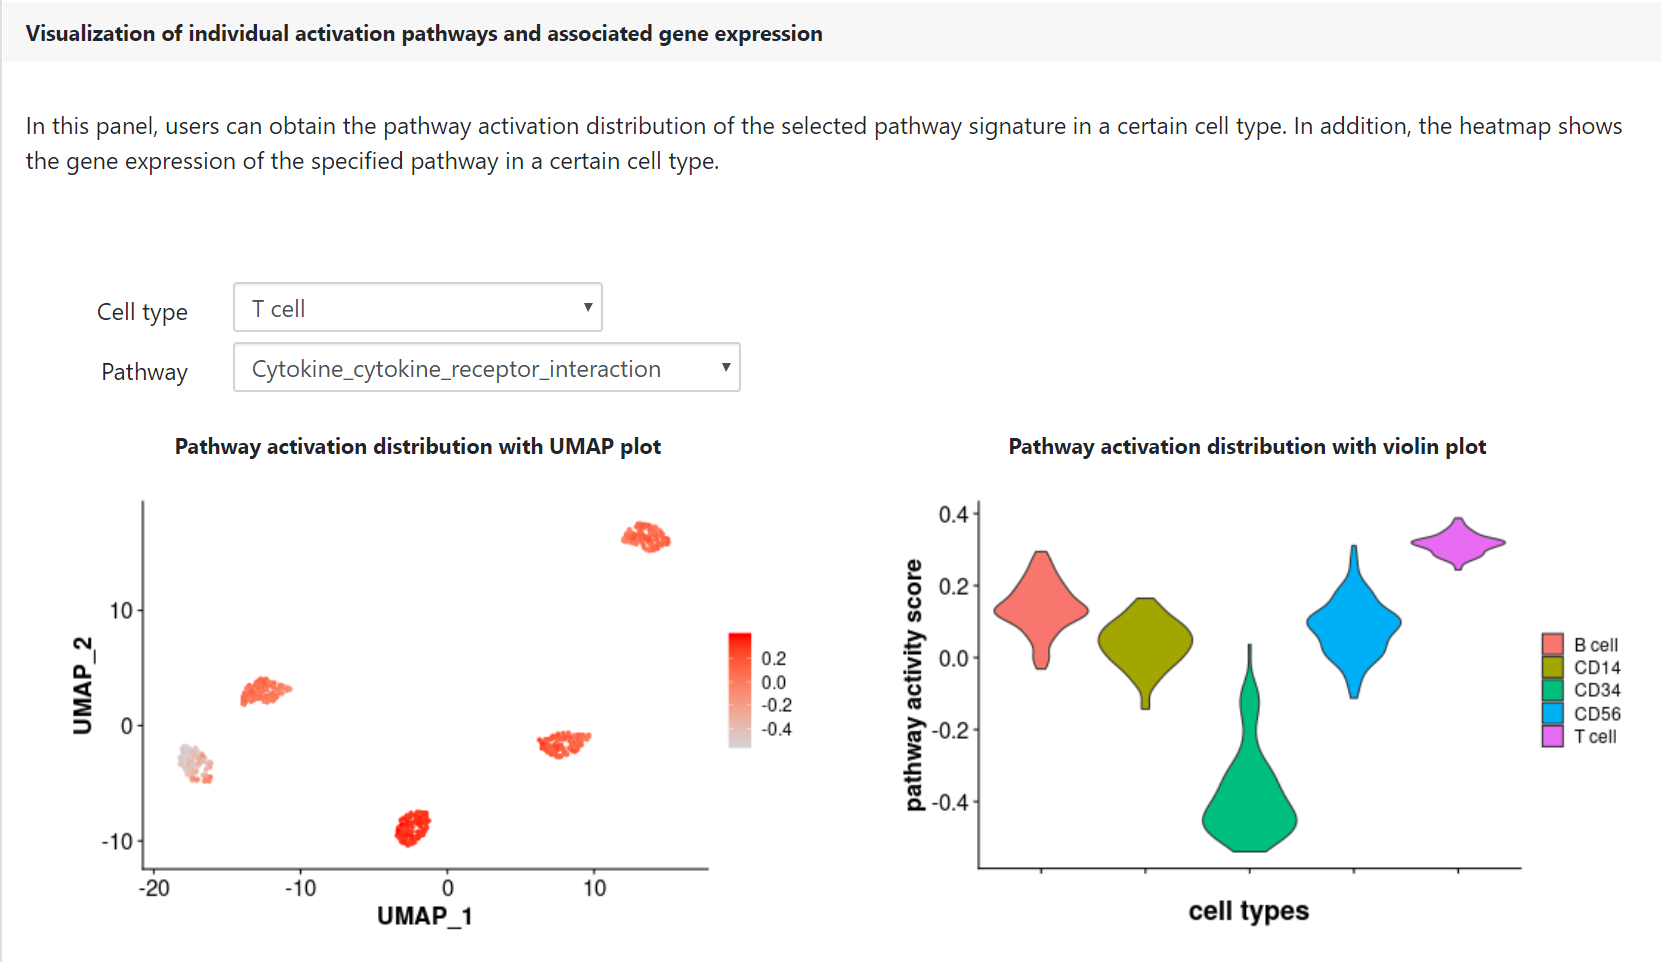
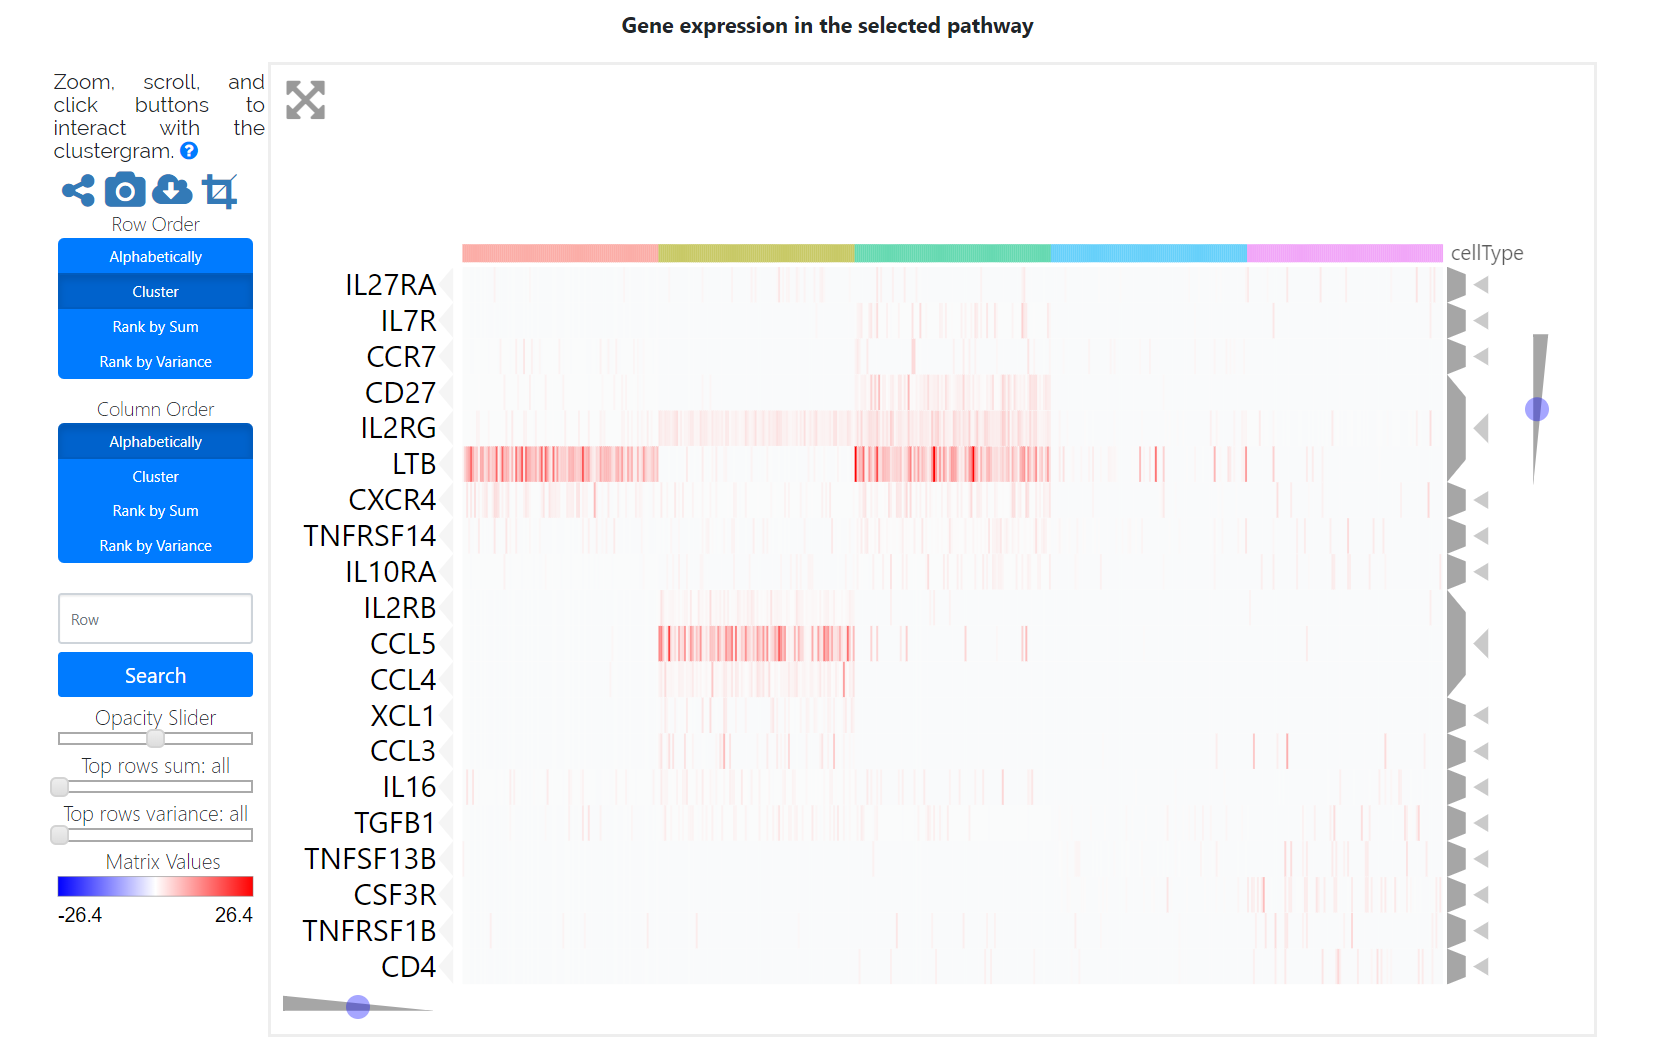
Finally, users can check the pathway activation distribution for an individual pathway of interest by selecting a given cell type and a given pathway in the corresponding drop-down menu. The heatmap displays the gene expression patterns of the selected cell-type-specific activation pathway, which may be helpful for the identification of marker genes and functional regulators.
Job retrieval
It is highly recommended to provide an e-mail address to receive a notification when the results become available. You may also bookmark the results page after submitting your data. Once the results are available, you may fetch your results from the bookmarked page.
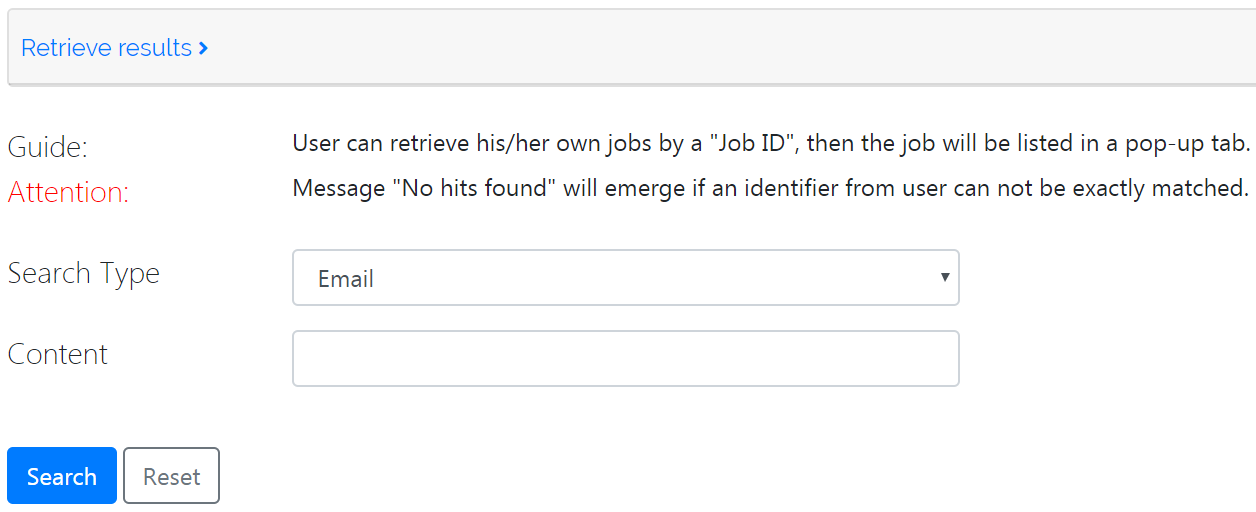
Additionally, the user can retrieve their jobs by clicking the ‘Result retrieve’ tag to show the Job Search page. By inputting the keywords of ‘Job ID’ and ’Email’, the jobs submitted by a user within the last 7 days are listed in a pop-up tab and can be retrieved without additional calculation.
References
1. Tirosh, I. et al. Dissecting the multicellular ecosystem of metastatic melanoma by single-cell RNA-seq. Science 352, 189-196, doi:10.1126/science.aad0501 (2016).
2. Zheng, G. X. et al. Massively parallel digital transcriptional profiling of single cells. Nat Commun 8, 14049, doi:10.1038/ncomms14049 (2017).
3. Xiao, Z., Dai, Z. & Locasale, J. W. Metabolic landscape of the tumor microenvironment at single cell resolution. Nat Commun 10, 3763, doi:10.1038/s41467-019-11738-0 (2019).
4. Jaitin, D. A. et al. Massively parallel single-cell RNA-seq for marker-free decomposition of tissues into cell types. Science 343, 776-779, doi:10.1126/science.1247651 (2014).
5. Grubman, A. et al. A single-cell atlas of entorhinal cortex from individuals with Alzheimer's disease reveals cell-type-specific gene expression regulation. Nat Neurosci 22, 2087-2097, doi:10.1038/s41593-019-0539-4 (2019).
6. Li, W. V. & Li, J. J. An accurate and robust imputation method scImpute for single-cell RNA-seq data. Nat Commun 9, 997, doi:10.1038/s41467-018-03405-7 (2018).
7. Rahmati, S. et al. pathDIP 4: an extended pathway annotations and enrichment analysis resource for human, model organisms and domesticated species. Nucleic Acids Res, doi:10.1093/nar/gkz989 (2019).
8. Hanzelmann, S., Castelo, R. & Guinney, J. GSVA: gene set variation analysis for microarray and RNA-seq data. BMC Bioinformatics 14, 7, doi:10.1186/1471-2105-14-7 (2013).
9. Butler, A., Hoffman, P., Smibert, P., Papalexi, E. & Satija, R. Integrating single-cell transcriptomic data across different conditions, technologies, and species. Nat Biotechnol 36, 411-420, doi:10.1038/nbt.4096 (2018).
Citation
Zhang Y*, Zhang Y*, Hu J*, Zhang J, Guo F, Zhou M, Zhang G#, Yu F#, Su J#.
scTPA: A web tool for single-cell transcriptome analysis of pathway activation signatures.
Bioinformatics. 2020.
Zhang Y*, Ma Y*, Huang Y, Zhang Y, Jiang Q, Zhou M, Su J#. Benchmarking algorithms for
pathway activity transformation of single-cell RNA-seq data.
Computational and Structural Biotechnology Journal (Accepted)
GitHub
https://github.com/sulab-wmu/scTPA